To evaluate the effectiveness of my digital marketing efforts, I used Google Analytics 4 (GA4) to examine website traffic to dalankennedy.com from July 15 through October 14, 2026. I focused on three key areas: User Acquisition, Page Views & Unique Page Views, and Demographic Details. My goal is to build an effective professional portfolio and increase visibility among potential employers, including Nike and Charles Schwab.
User acquisition helps identify where website visitors are coming from and which marketing channels are most effective. Page views and user metrics help determine which website pages and blog posts attract the most attention. Demographic details provide information about visitors’ geographic locations, helping evaluate whether my content is reaching audiences in locations relevant to my career goals.
By organizing the information in Excel and using ChatGPT to analyze the results, I can identify trends, evaluate website performance, and develop actionable digital marketing strategies to improve engagement and increase professional visibility.
User acquisition – First user source / medium
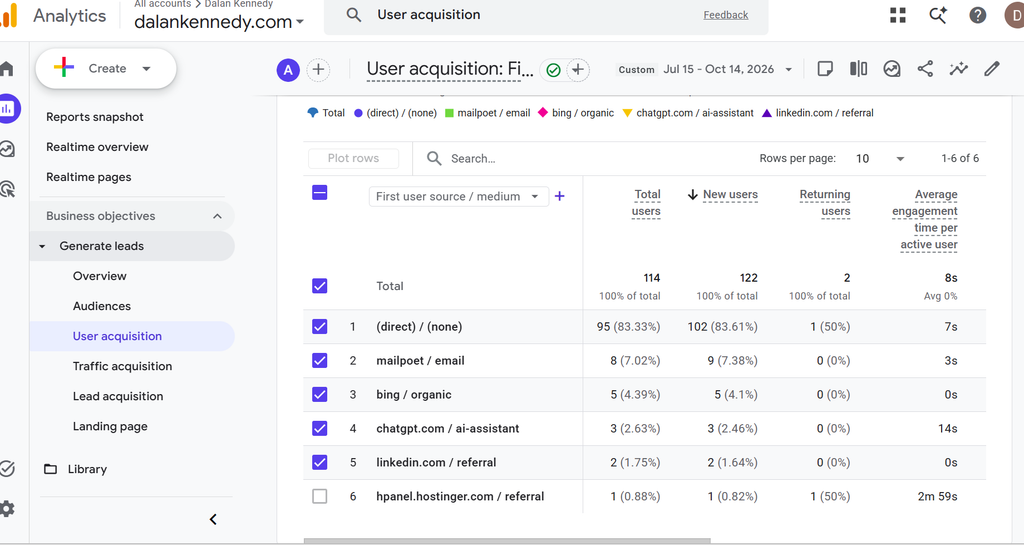
I used First user source / medium in Google Analytics 4 (GA4) to identify how visitors initially discovered my website. This information is important because it helps me evaluate which marketing channels, such as LinkedIn, email marketing, search engines, and direct traffic, are most effective at attracting new visitors. Understanding these traffic sources allows me to improve my digital marketing strategies and increase the visibility of my professional portfolio among potential employers, including Nike and Charles Schwab.
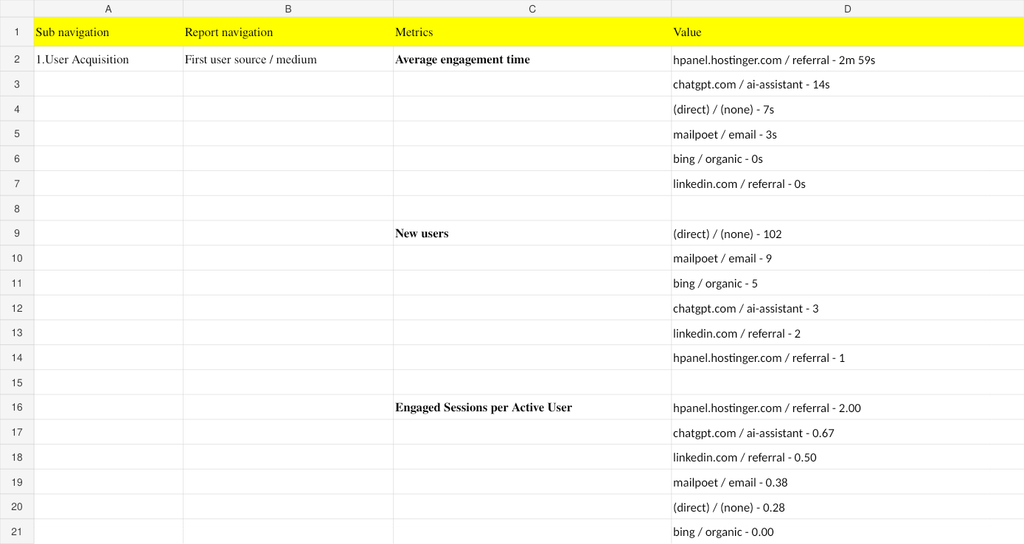
The three metrics I analyzed were Average engagement time per active user, New users, and Engaged sessions per active user. Average engagement time measures how long visitors actively engage with my website, helping determine whether my content captures their attention. New users identifies how many first-time visitors discover my website, allowing me to evaluate the effectiveness of my promotional efforts. Engaged sessions per active user measures the average number of meaningful sessions per active visitor, helping me understand how frequently visitors interact with my content. Together, these metrics provide valuable insights into website traffic, visitor interest, and opportunities for improvement.
Average Engagement Time
ChatGPT Prompt:
Act as a digital marketing analyst. Analyze my Google Analytics 4 data for dalankennedy.com from July 15 to October 14, 2026. When I sorted Average engagement time per active user in descending order under First user source / medium, the following results appeared: Hostinger referral (2m 59s), ChatGPT (14s), Direct (7s), MailPoet email (3s), Bing organic (0s), and LinkedIn referral (0s). Explain what these results mean, identify important trends, and recommend strategies to improve website engagement and visibility among prospective employers, including Nike and Charles Schwab.
ChatGPT Results and Analysis:
The results show that Hostinger referrals recorded the highest average engagement time at 2 minutes and 59 seconds. However, this result represents only one user and may reflect website administration activity rather than an external visitor.
ChatGPT referrals averaged 14 seconds of engagement, followed by direct traffic at 7 seconds and email traffic at 3 seconds. Bing and LinkedIn recorded no measurable average engagement time during this reporting period.
These findings indicate opportunities to improve how visitors interact with my professional portfolio. Although direct traffic attracts a significant number of visitors, the relatively short engagement time suggests that improvements to website navigation, content organization, and calls to action may encourage visitors to explore additional pages.
Actionable Marketing Insights:
To improve engagement, I recommend strengthening the homepage with links to my Nike and Charles Schwab portfolio projects, sharing more targeted content through LinkedIn, and improving internal navigation. I would also review GA4 tracking accuracy and continue monitoring engagement to determine whether these improvements are effective.
New Users
ChatGPT Prompt:
Act as a digital marketing analyst. Analyze my Google Analytics 4 data for dalankennedy.com from July 15 to October 14, 2026. When I sorted New Users in descending order under First user source / medium, the following results appeared: Direct (102), MailPoet email (9), Bing organic (5), ChatGPT (3), LinkedIn referral (2), and Hostinger referral (1). Explain what these results mean, identify the most effective traffic sources, and recommend actionable strategies to increase website traffic and visibility among potential employers, including Nike and Charles Schwab.
ChatGPT Results and Analysis:
Google Analytics recorded a total of 122 new users during the reporting period. Direct traffic accounted for 102 new users, representing approximately 83.6% of all new visitors. This indicates that most new visitors arrived without an identifiable referral source. They may have entered the website address directly or accessed the website through links that were not properly tracked.
MailPoet email generated 9 new users, making it the second-largest traffic source. Bing organic search contributed 5 new users, suggesting that the website has some visibility through search engines. ChatGPT referrals generated 3 new users, LinkedIn contributed 2, and Hostinger generated 1.
Although direct traffic accounts for most new visitors, the relatively small number of LinkedIn referrals indicates an opportunity to strengthen professional networking and digital marketing promotion.
Actionable Marketing Insights:
To increase website traffic, I recommend sharing my Nike and Charles Schwab digital marketing projects more frequently on LinkedIn, optimizing blog posts with relevant SEO keywords, and improving email marketing campaigns. I would also use trackable links to better identify which promotional activities generate website visitors.
These strategies could increase my website’s visibility, attract more visitors to my professional portfolio, and improve opportunities to connect with prospective employers.
Engaged Sessions per Active User
ChatGPT Prompt:
Act as a digital marketing analyst. Analyze my Google Analytics 4 data for dalankennedy.com from July 15 to October 14, 2026. When I sorted Engaged Sessions per Active User in descending order under First user source / medium, the following results appeared: Hostinger referral (2.00), ChatGPT (0.67), LinkedIn referral (0.50), MailPoet email (0.38), Direct (0.28), and Bing organic (0.00). Explain what these results mean, identify which traffic sources demonstrate the strongest engagement, and recommend actionable digital marketing strategies to improve website engagement and attract potential employers, including Nike and Charles Schwab.
ChatGPT Results and Analysis:
The results show that Hostinger referrals recorded the highest number of engaged sessions per active user at 2.00. However, this result represents only one active user and may be associated with website administration rather than external visitors.
ChatGPT referrals recorded 0.67 engaged sessions per active user, followed by LinkedIn at 0.50 and MailPoet email at 0.38. These results suggest that these traffic sources generated some meaningful interactions with my website, although their relatively small audiences limit the conclusions that can be drawn.
Direct traffic recorded 0.28 engaged sessions per active user. Although direct traffic generated the largest number of new visitors, its relatively low engagement suggests opportunities to improve the visitor experience. Bing organic search recorded 0.00, indicating that no engaged sessions were measured from this source during the reporting period.
Actionable Marketing Insights:
To improve visitor engagement, I recommend making my professional portfolio easier to navigate, adding clear calls to action, and highlighting my Nike and Charles Schwab projects on the homepage.
I would also strengthen LinkedIn promotion by sharing individual portfolio projects with direct links to the website. Improving SEO, refining email marketing content, and monitoring GA4 engagement metrics could help increase meaningful website interactions.
Overall, these findings demonstrate that attracting visitors is only one part of successful digital marketing. Encouraging visitors to explore content and interact with the website is equally important.
Engagement – Page title and screens
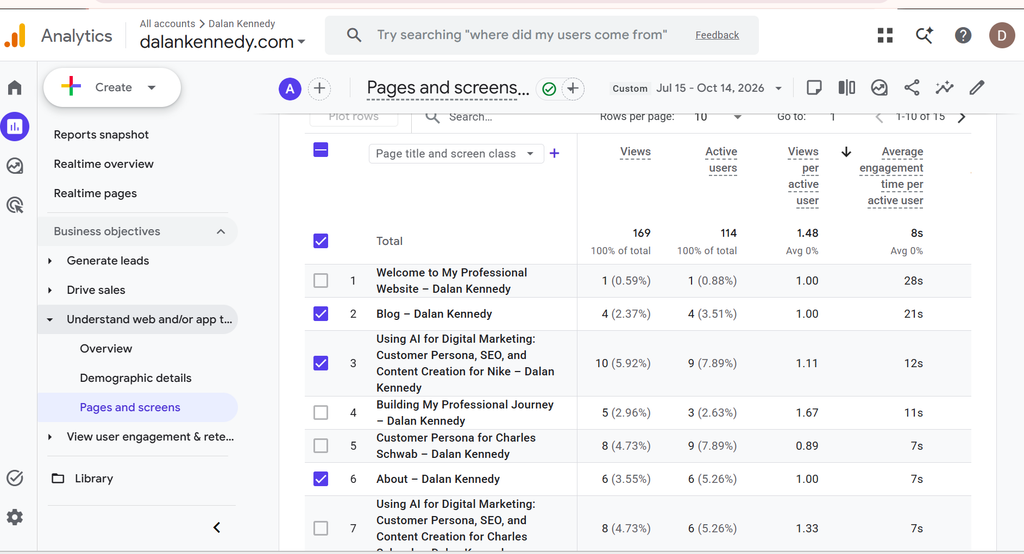
I used the Page title and screen class report in Google Analytics 4 (GA4) to identify which pages and blog posts on my website attract the most visitors and generate the strongest engagement. This information is important because it helps me understand which content is most effective at showcasing my professional skills and attracting interest from potential employers, including Nike and Charles Schwab.
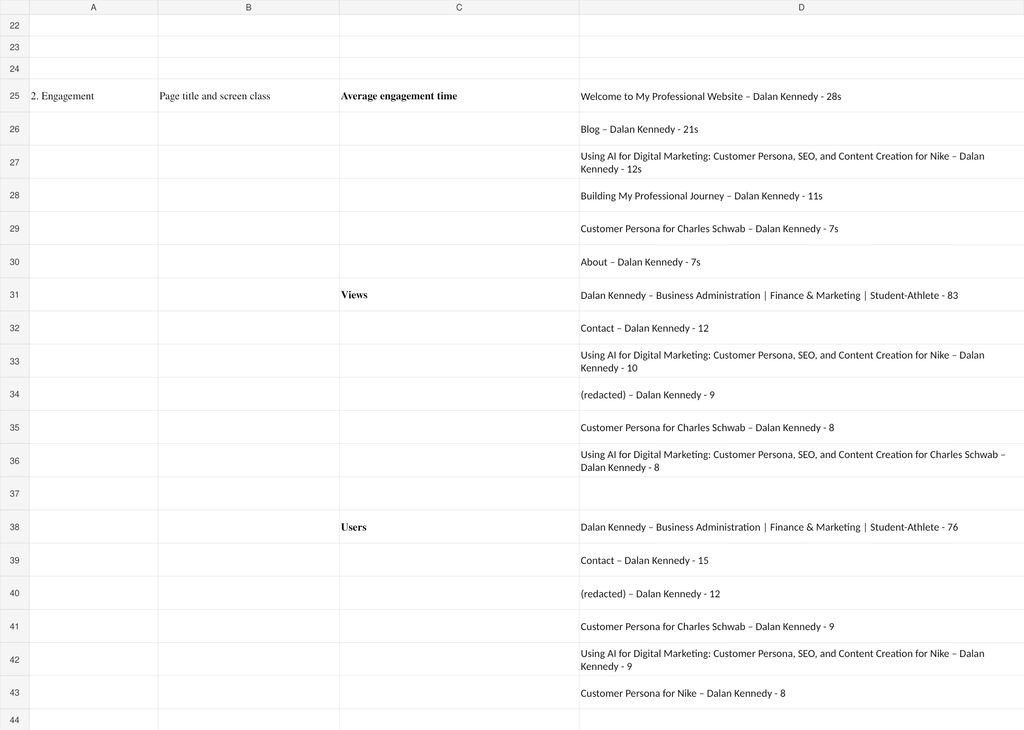
The three metrics I analyzed were Average engagement time per active user, Views, and Users (Active users). Average engagement time measures how long visitors actively interact with website content, helping determine which pages capture and maintain attention. Views measures how many times each page is viewed, including repeat visits, helping identify the most popular content. Active users measures how many distinct active visitors access each page, providing insight into the reach of my content.
Together, these metrics help evaluate the effectiveness of my website content and promotional strategies. By identifying which pages receive the most attention and engagement, I can make informed decisions about improving my portfolio, strengthening website navigation, and increasing visibility among prospective employers.
Average Engagement Time
ChatGPT Prompt:
Act as a digital marketing analyst. Analyze my Google Analytics 4 data for dalankennedy.com from July 15 to October 14, 2026. When I sorted Average engagement time per active user in descending order under Page title and screen class, the following results appeared: Welcome to My Professional Website (28 seconds), Blog (21 seconds), Using AI for Digital Marketing – Nike (12 seconds), Building My Professional Journey (11 seconds), Customer Persona for Charles Schwab (7 seconds), and About (7 seconds). Explain what these results mean, identify which pages demonstrate the strongest engagement, and recommend actionable improvements to increase website engagement and attract potential employers, including Nike and Charles Schwab.
ChatGPT Results and Analysis:
The results show that the Welcome to My Professional Website page recorded the highest average engagement time at 28 seconds. However, this result represents only one active user, making it difficult to determine whether the page consistently attracts strong engagement.
The Blog page recorded 21 seconds of average engagement time, suggesting that visitors are spending time exploring my digital marketing content. My Nike digital marketing project followed with 12 seconds, while Building My Professional Journey averaged 11 seconds.
The Charles Schwab Customer Persona and About pages each recorded 7 seconds of average engagement time. These findings suggest opportunities to improve how professional information and portfolio projects are presented to visitors.
Actionable Marketing Insights:
To increase website engagement, I recommend improving the readability of my portfolio projects by including clear headings, visual examples, and concise summaries of important findings.
I would also strengthen internal links between my homepage, blog posts, and Nike and Charles Schwab projects to encourage visitors to explore additional content. Adding clear calls to action, such as opportunities to review related projects or connect on LinkedIn, could further improve engagement.
Continuing to monitor average engagement time in GA4 will help me determine whether these changes are effective. Because some pages have relatively few visitors, I would collect additional data before drawing strong conclusions about their performance.
Views
ChatGPT Prompt:
Act as a digital marketing analyst. Analyze my Google Analytics 4 data for dalankennedy.com from July 15 to October 14, 2026. When I sorted Views in descending order under Page title and screen class, the following results appeared: Dalan Kennedy – Business Administration, Finance & Marketing (83 views), Contact (12 views), Using AI for Digital Marketing – Nike (10 views), Redacted Page (9 views), Customer Persona for Charles Schwab (8 views), and Using AI for Digital Marketing – Charles Schwab (8 views). The website recorded 169 total views. Explain what these results mean, identify the most popular content, and recommend actionable strategies to improve website visibility and engagement among potential employers, including Nike and Charles Schwab.
ChatGPT Results and Analysis:
Google Analytics recorded 169 total website views during the reporting period. My professional homepage received 83 views, accounting for approximately 49.1% of all website views. This indicates that the homepage is my most frequently viewed page and plays an important role in introducing visitors to my professional background, education, and career interests.
The Contact page received 12 views, making it the second most viewed page. This suggests visitors are accessing information about how to connect with me, although page views alone do not indicate whether visitors actually contacted me.
My Nike digital marketing project received 10 views, while my Charles Schwab Customer Persona and AI Digital Marketing projects each received 8 views. These results indicate that visitors are also exploring content that demonstrates my ability to apply digital marketing concepts to real businesses.
The redacted page received 9 views, but additional information would be needed to evaluate its content and purpose.
Actionable Marketing Insights:
To increase visibility and engagement, I recommend featuring my strongest Nike and Charles Schwab portfolio projects more prominently on my homepage. Since the homepage attracts the most views, adding direct links to these projects could encourage visitors to explore my work.
I would also increase promotion of individual blog posts through LinkedIn, strengthen search engine optimization using relevant business and marketing keywords, and include internal links between related portfolio projects.
These improvements could help direct more visitors to content that demonstrates my professional skills and qualifications. I would continue monitoring GA4 page views and engagement metrics to evaluate the effectiveness of these strategies.
Overall, the results demonstrate that my homepage is successfully attracting attention, while my portfolio projects offer opportunities for additional promotion and increased visibility among prospective employers.
Users
ChatGPT Prompt:
Act as a digital marketing analyst. Analyze my Google Analytics 4 data for dalankennedy.com from July 15 to October 14, 2026. When I sorted Active Users in descending order under Page title and screen class, the following results appeared: Dalan Kennedy – Business Administration, Finance & Marketing (76 active users), Contact (15 active users), Redacted Page (12 active users), Customer Persona for Charles Schwab (9 active users), Using AI for Digital Marketing – Nike (9 active users), and Customer Persona for Nike (8 active users). Explain what these results mean, identify which pages attract the most visitors, and recommend actionable strategies to increase website engagement and professional visibility among potential employers, including Nike and Charles Schwab.
ChatGPT Results and Analysis:
The results show that my professional homepage attracted the largest audience, with 76 active users during the reporting period. This indicates that the homepage plays an important role in introducing visitors to my educational background, professional qualifications, and career interests.
The Contact page attracted 15 active users, suggesting that visitors are accessing information about how to connect with me. However, this does not necessarily mean visitors submitted inquiries or contacted me directly.
The redacted page recorded 12 active users, although additional information would be needed to evaluate its content.
My Charles Schwab Customer Persona and Nike AI Digital Marketing projects each attracted 9 active users, while my Nike Customer Persona project attracted 8. These results demonstrate that visitors are exploring portfolio content that showcases my digital marketing knowledge, research abilities, and application of artificial intelligence.
Because visitors can access multiple pages, these individual page counts should not be added together to determine the total number of website users.
Actionable Marketing Insights:
To increase website engagement and professional visibility, I recommend featuring my Nike and Charles Schwab projects prominently on the homepage. Providing direct links to these projects could encourage visitors to explore additional content.
I would also strengthen LinkedIn promotion by sharing individual portfolio projects, improve internal navigation between related blog posts, and include clear calls to action encouraging visitors to connect professionally.
Continuing to monitor Active Users alongside Views and Average Engagement Time will help me evaluate whether these marketing strategies increase the reach and effectiveness of my professional portfolio.
Overall, the findings demonstrate that my homepage attracts the largest audience, while my Nike and Charles Schwab projects provide valuable opportunities to showcase professional skills to prospective employers.
User attribute – Demographic details
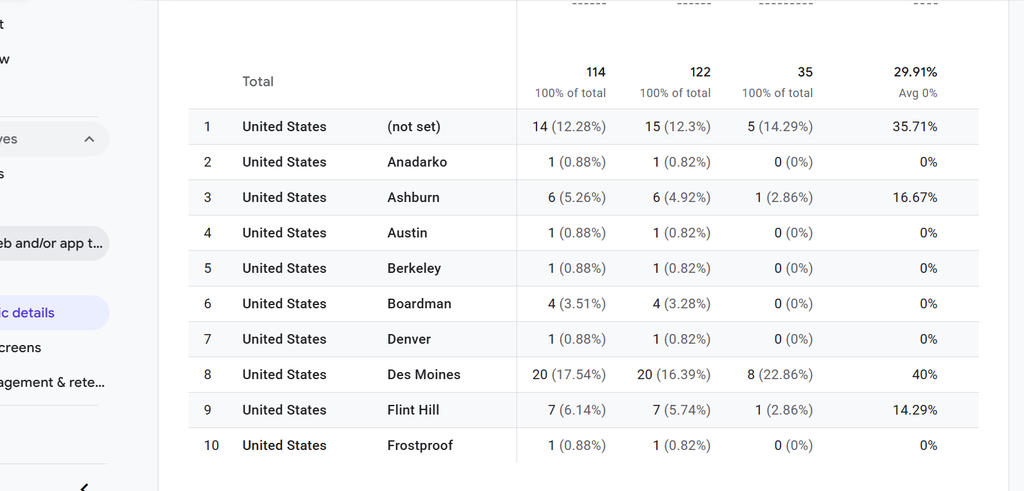
I used the Country and City classification in Google Analytics 4 (GA4) to identify the geographic locations of visitors to my website. This information is important because it helps me evaluate whether my digital marketing efforts are reaching audiences in locations relevant to my professional career goals. Since I am interested in potential employment opportunities with companies such as Nike and Charles Schwab, understanding the geographic distribution of website traffic can help me develop more targeted marketing strategies. For this analysis, I selected five cities: Los Angeles, Omaha, Austin, San Jose, and Des Moines.
The four metrics I analyzed were Active Users, Engagement Rate, Average Engagement Time per Active User, and Engaged Sessions per Active User.
Active Users measures the number of active website visitors from each geographic location, helping me understand which cities generate the most traffic.
Engagement Rate measures the percentage of website sessions that meet GA4’s engagement criteria. This helps determine how effectively visitors from different locations interact with my content.
Average Engagement Time per Active User measures how long visitors from each location actively engage with my website on average. This provides insight into how effectively my content captures and maintains visitor attention.
Engaged Sessions per Active User measures the average number of engaged sessions generated by each active user. This helps evaluate the frequency of meaningful website interactions across different geographic locations.
Together, these four metrics provide valuable insights into geographic reach and visitor engagement. By analyzing these results using ChatGPT, I can identify opportunities to improve website content, strengthen targeted LinkedIn promotion, and increase the visibility of my professional portfolio among potential employers. Geographic data cannot confirm whether individual visitors work for Nike or Charles Schwab.
ChatGPT Prompt:
Act as a digital marketing analyst. Analyze my Google Analytics 4 data for dalankennedy.com from July 15 to October 14, 2026. My professional goal is to increase website visibility among potential employers, particularly Nike and Charles Schwab. My five cities of interest are Los Angeles, Omaha, Austin, San Jose, and Des Moines.
Analyze the following four metrics from the Country and City classification:
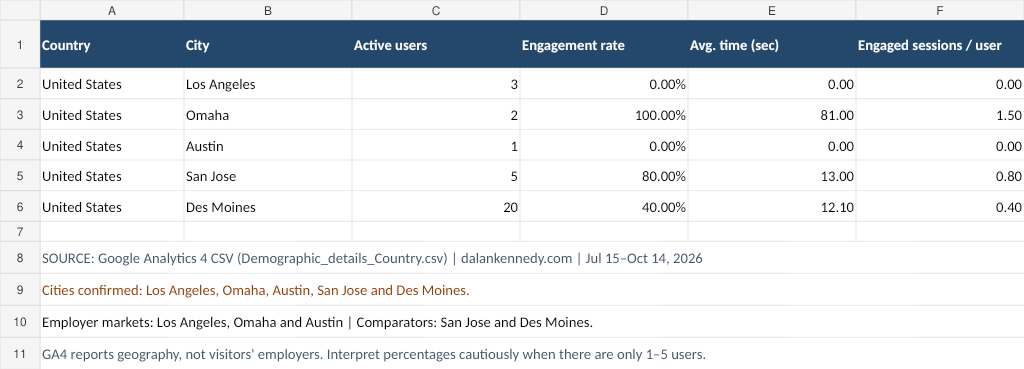
1. Active Users: Des Moines (20), San Jose (5), Los Angeles (3), Omaha (2), and Austin (1).
2. Engagement Rate: Omaha (100%), San Jose (80%), Des Moines (40%), Los Angeles (0%), and Austin (0%).
3. Average Engagement Time per Active User: Omaha (81 seconds), San Jose (13 seconds), Des Moines (12.1 seconds), Los Angeles (0 seconds), and Austin (0 seconds).
4. Engaged Sessions per Active User: Omaha (1.50), San Jose (0.80), Des Moines (0.40), Los Angeles (0.00), and Austin (0.00).
Explain what each metric reveals about my website’s performance, compare the five cities, identify opportunities for improvement, and recommend actionable digital marketing strategies. Consider small sample sizes and avoid assuming visitors work for the target companies. Provide an overall conclusion.
ChatGPT Results and Analysis:
1. Active Users
Des Moines generated the highest number of active users, with 20 visitors, followed by San Jose with 5, Los Angeles with 3, Omaha with 2, and Austin with 1.
These results indicate that my website has attracted the largest audience from Des Moines. However, website traffic from Los Angeles, Omaha, and Austin remains limited. Since these locations are relevant to potential employment opportunities, increasing visibility in these markets could strengthen my professional networking efforts.
2. Engagement Rate
Omaha recorded the highest engagement rate at 100%, followed by San Jose at 80% and Des Moines at 40%. Los Angeles and Austin recorded engagement rates of 0%.
These findings suggest that website sessions from Omaha and San Jose demonstrated relatively strong engagement. However, Omaha had only two active users, so the 100% engagement rate should be interpreted cautiously. Engagement rate measures the percentage of sessions that meet GA4’s engagement criteria, rather than the percentage of individual visitors.
3. Average Engagement Time per Active User
Omaha recorded the highest average engagement time at 81 seconds, followed by San Jose at 13 seconds and Des Moines at 12.1 seconds. Los Angeles and Austin recorded no measurable engagement time.
These findings suggest that visitors from Omaha spent more time actively engaging with my website on average. However, the limited number of visitors makes it difficult to determine whether this trend will continue.
Improving the presentation of my portfolio projects and providing clear links to additional content may encourage visitors from other locations to spend more time exploring the website.
4. Engaged Sessions per Active User
Omaha recorded the highest number of engaged sessions per active user at 1.50, followed by San Jose at 0.80 and Des Moines at 0.40. Los Angeles and Austin recorded 0.00.
These results indicate that Omaha demonstrated the strongest measured engagement frequency among the selected cities, although the small audience limits the strength of this conclusion.
The results suggest an opportunity to improve website engagement through more targeted content, stronger website navigation, and professional networking strategies.
Actionable Marketing Insights:
Based on the demographic analysis, I recommend the following digital marketing strategies:
- Strengthen LinkedIn promotion: Share my Nike and Charles Schwab projects with professional networks in geographic markets relevant to potential employment opportunities.
- Improve website engagement: Add clear calls to action, visual examples, and internal links to encourage visitors to explore additional portfolio projects.
- Enhance search engine optimization: Incorporate relevant marketing, finance, and business keywords to improve organic search visibility.
- Focus on targeted geographic markets: Increase professional networking efforts in Los Angeles, Omaha, and Austin while continuing to evaluate traffic and engagement from San Jose and Des Moines.
- Monitor website performance: Continue reviewing GA4 metrics to determine whether these strategies increase traffic, engagement, and visibility in targeted locations.
Overall Analysis:
The demographic analysis demonstrates that website performance varies across geographic locations. Des Moines generated the largest audience, while Omaha and San Jose demonstrated relatively strong engagement.
Although Los Angeles and Austin attracted some visitors, their engagement metrics indicate opportunities for improvement. These results do not establish whether individual visitors are employees of Nike or Charles Schwab.
By combining Google Analytics data with ChatGPT analysis, I can identify patterns in website performance, evaluate the effectiveness of my digital marketing efforts, and develop strategies to increase professional visibility among prospective employers.
Conclusion
Using Google Analytics 4 (GA4) and ChatGPT allowed me to evaluate the effectiveness of my digital marketing efforts and better understand how visitors interact with my professional website, dalankennedy.com. By analyzing user acquisition, page engagement, and demographic information, I gained valuable insights into my website’s performance and identified opportunities for improvement.
During the reporting period of July 15 through October 14, 2026, my website recorded 122 new users, 114 active users, and 169 page views. Direct traffic generated the largest number of new users, while my professional homepage received the most views. My Nike and Charles Schwab portfolio projects also attracted visitors, demonstrating opportunities to increase visibility for content that showcases my marketing knowledge and professional skills.
The demographic analysis revealed that Des Moines generated the most visitors among my selected cities, while Omaha and San Jose demonstrated stronger engagement metrics. However, some results were based on small numbers of visitors, highlighting the importance of collecting additional data before drawing definitive conclusions.
Based on these findings, my next steps include strengthening LinkedIn promotion, improving search engine optimization, making my portfolio projects more accessible from the homepage, and incorporating clearer calls to action. I also plan to continue monitoring GA4 metrics to evaluate whether these improvements increase website traffic and meaningful engagement.
Overall, this assignment demonstrated how Google Analytics and carefully developed ChatGPT prompts can work together to transform website data into actionable marketing insights. These skills are valuable for evaluating digital marketing performance, making data-driven decisions, and developing effective strategies that support my professional career goals.